
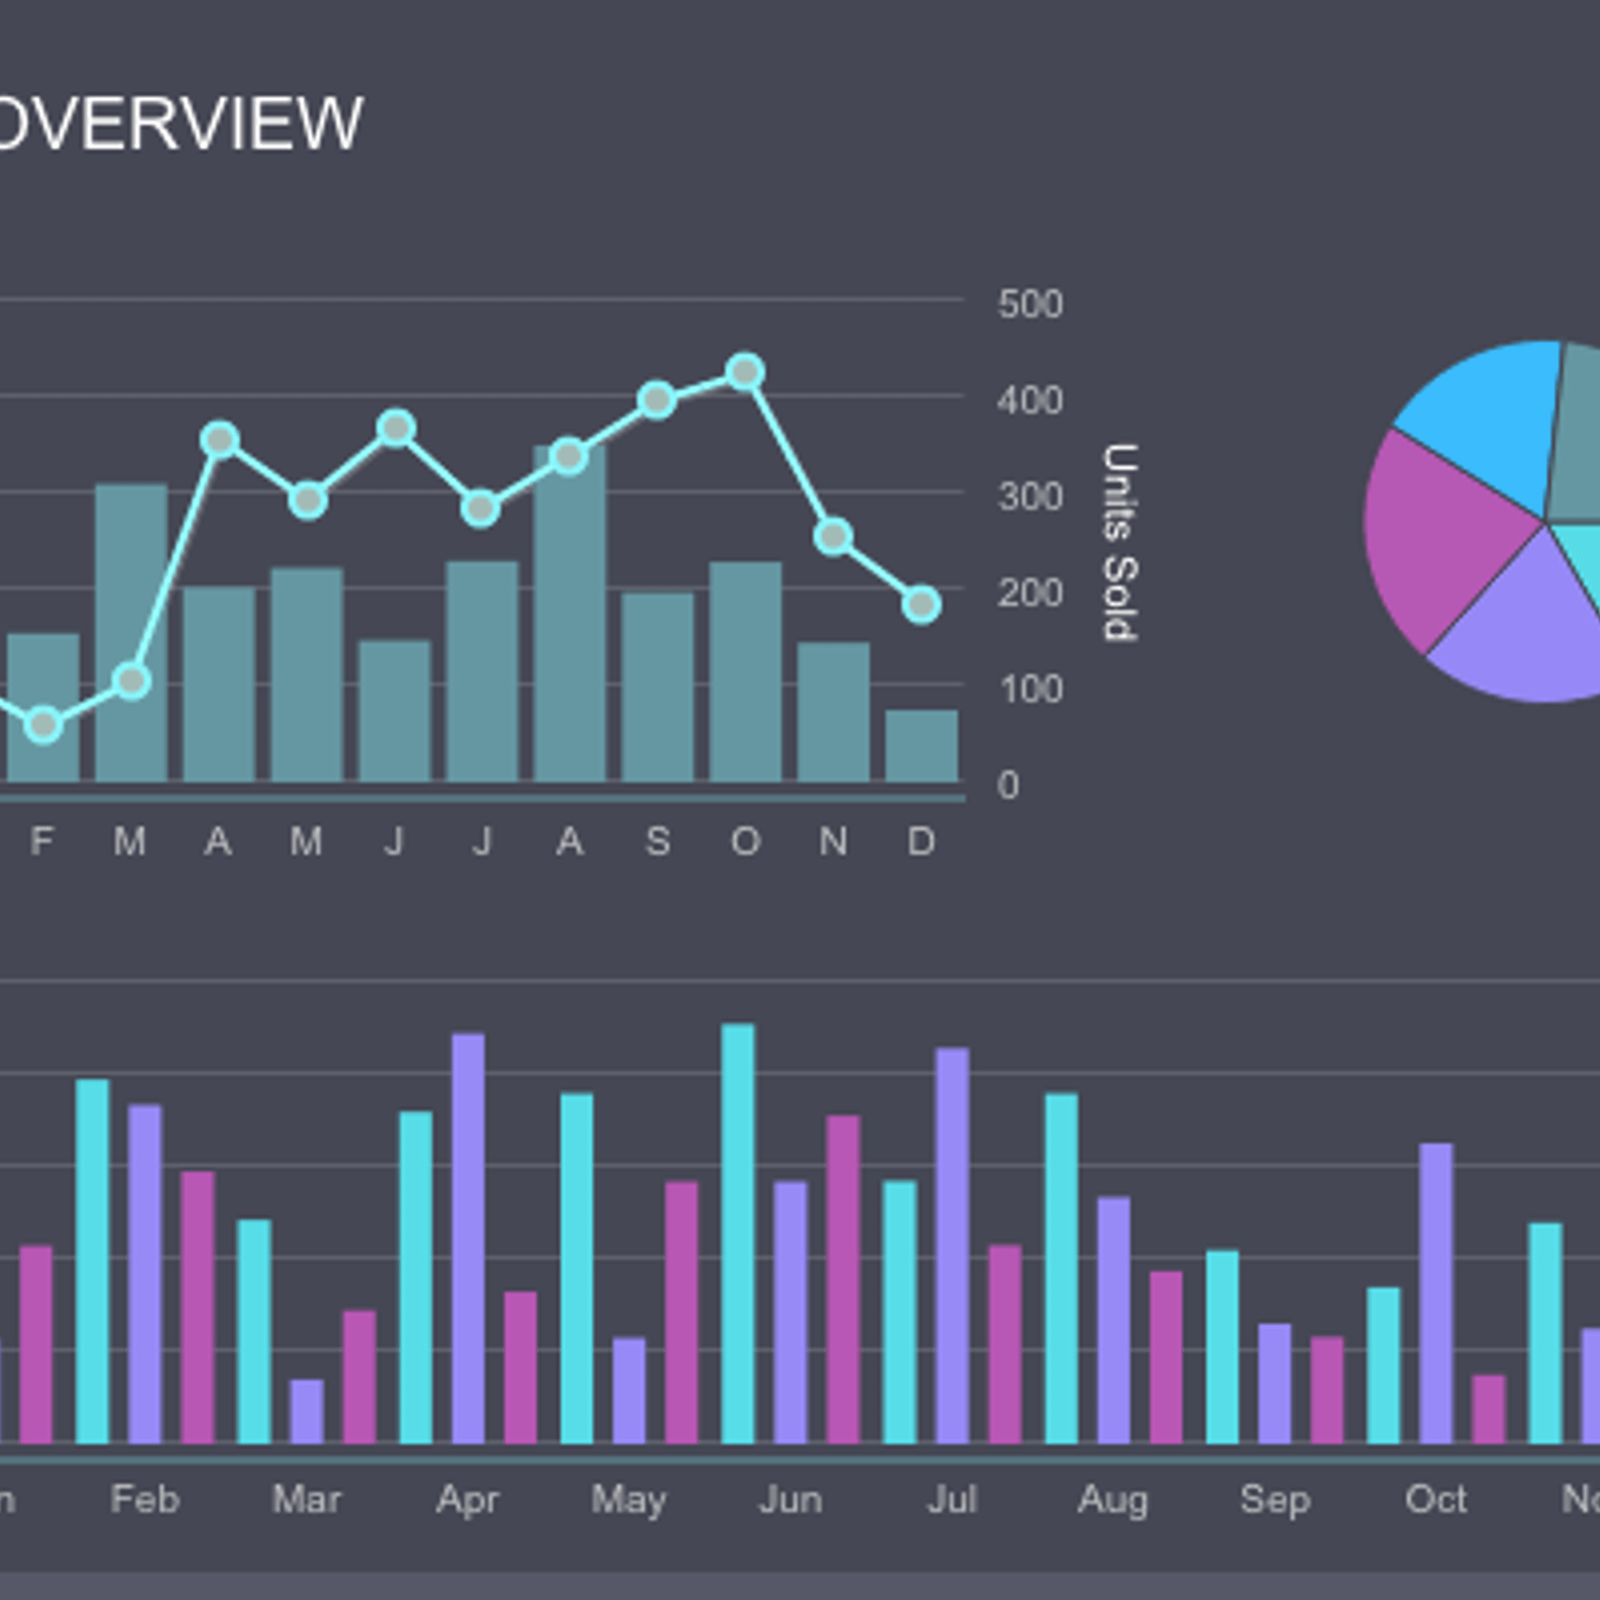
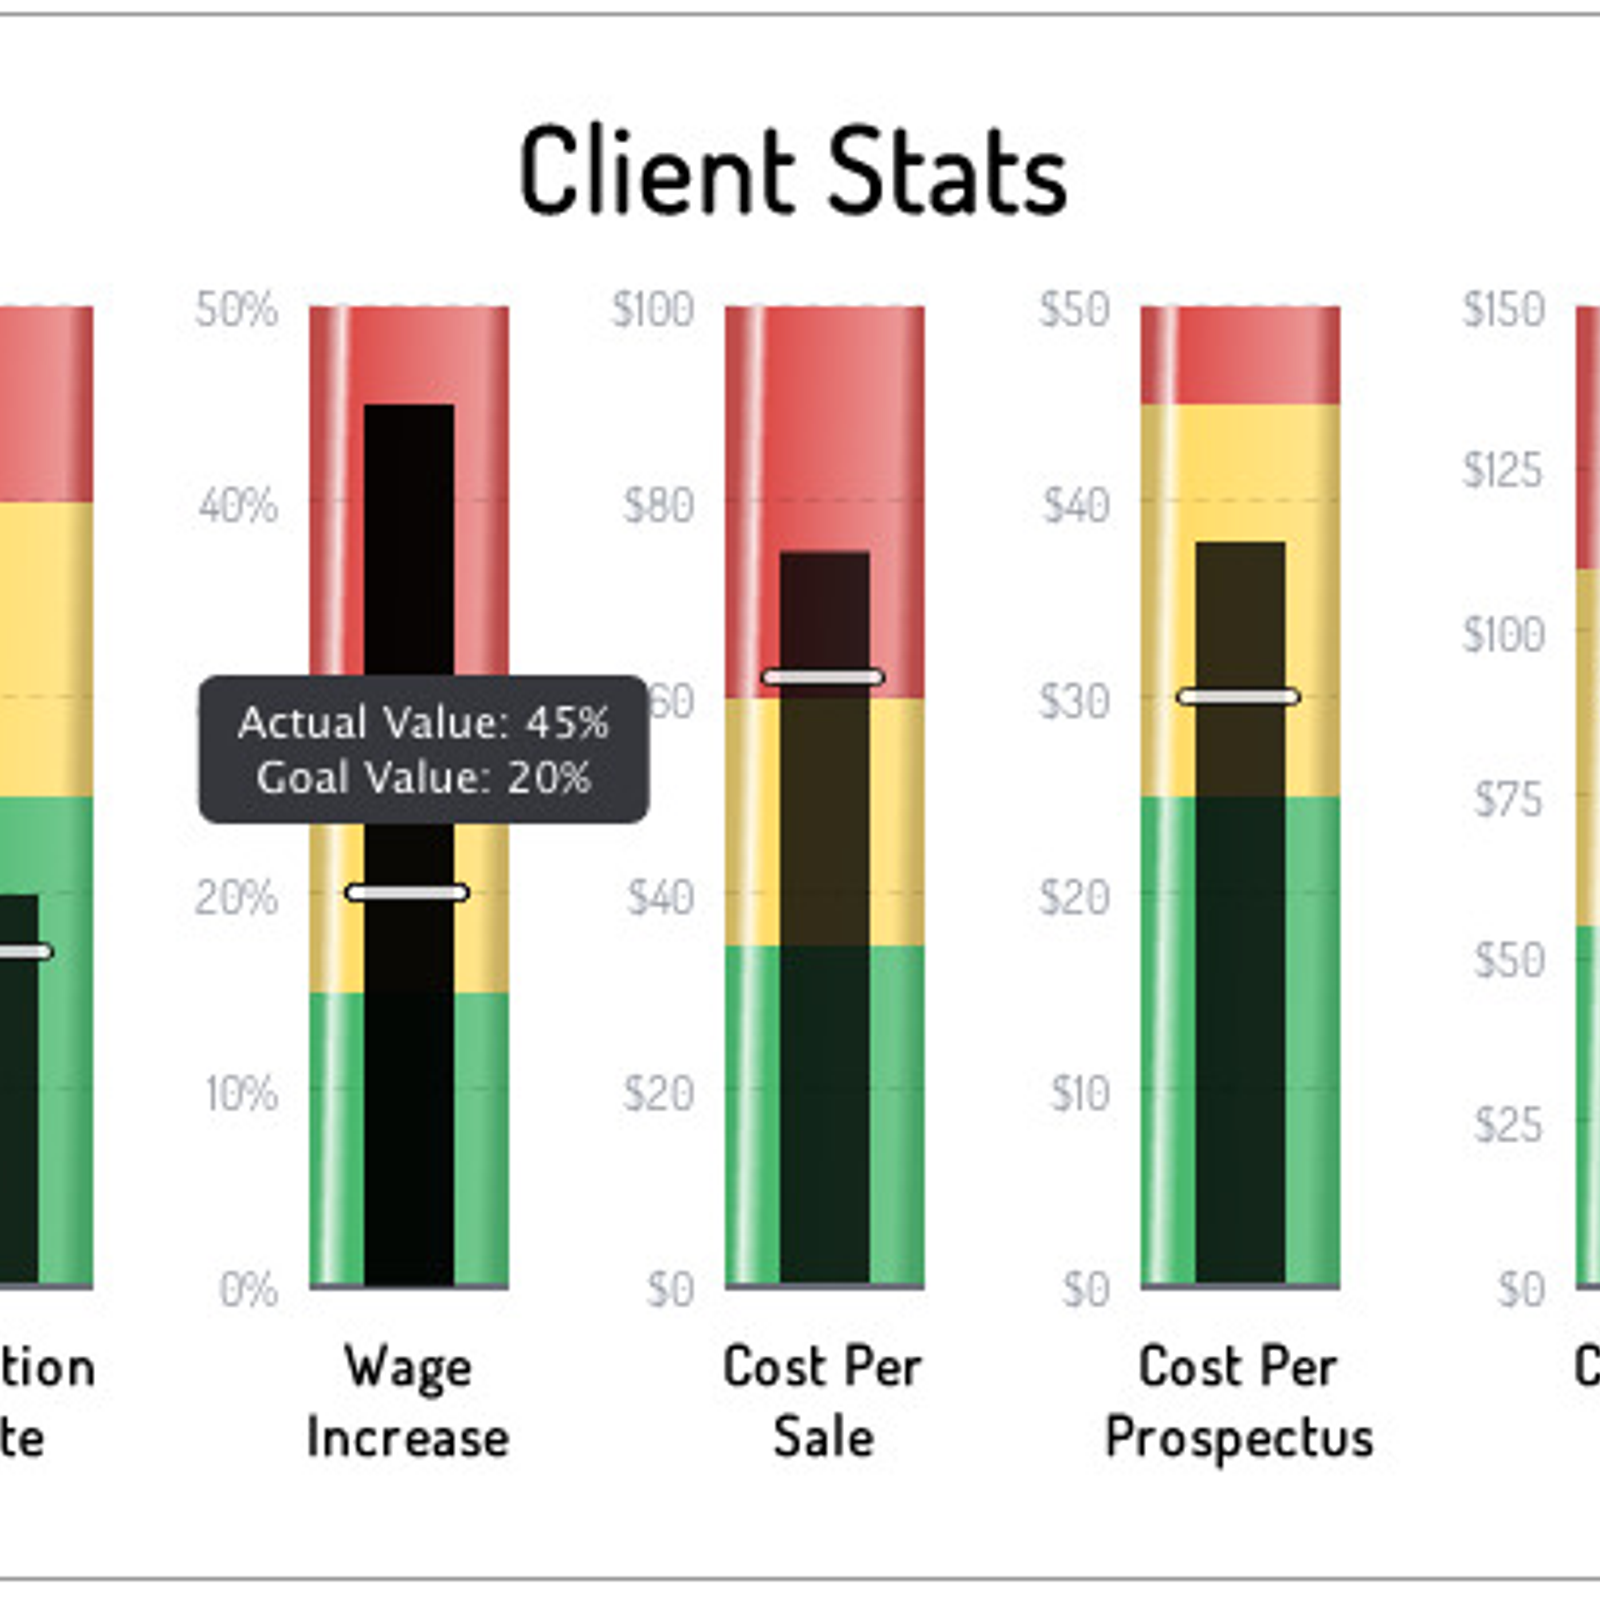
ZingChart is a JavaScript charting library that provides a wide range of interactive charts, graphs, and maps for web and mobile applications. Its features include data binding, drill-down capability, real-time updates, and 3D visualizations. The library is designed for developers to quickly create beautiful and interactive data visualizations in their applications. It comes with over 90 chart types, including pies, bars, lines, and gauges, as well as an extensive library of themes. It also supports various data formats, such as CSV, JSON, and XML. ZingChart also provides a wide range of APIs for customizing charts, such as adding events, annotations, and interactivity. It is also mobile-friendly, allowing developers to create responsive charts and graphs for any device.

 Google Charts
 Highcharts
 AnyChart
 Vis.js
 CanvasJS Charts
 Raphaël
 amCharts
 PykCharts.js
 ZoomCharts
 uvCharts
 RGraph
 KoolChart
 FancyGrid
 ChartURL
 FusionCharts Suite XT
 ArcadiaCharts
 liveGap Charts
ZingChart Comments
No Comments