
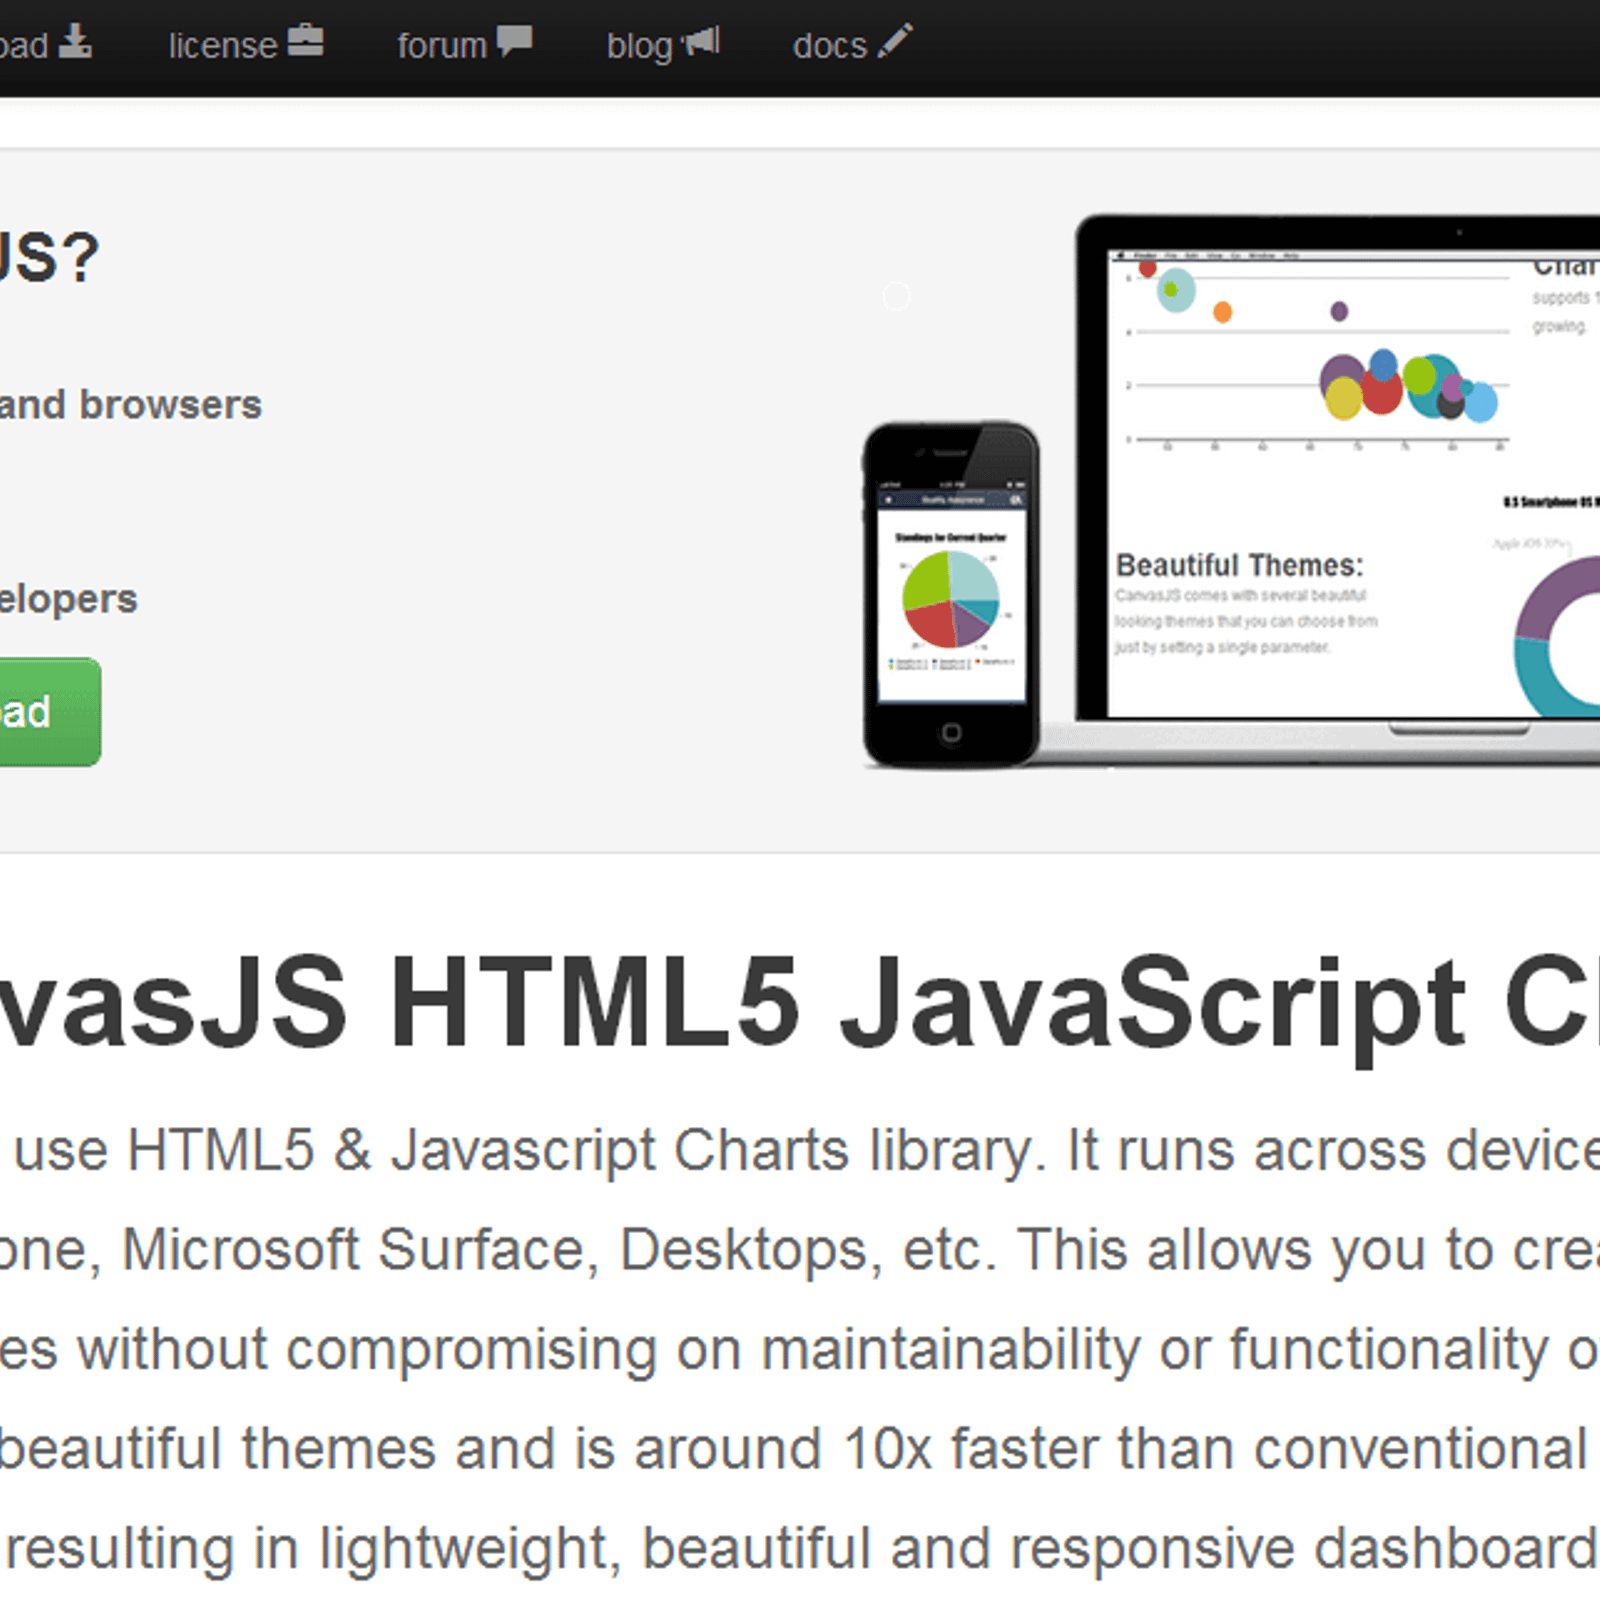
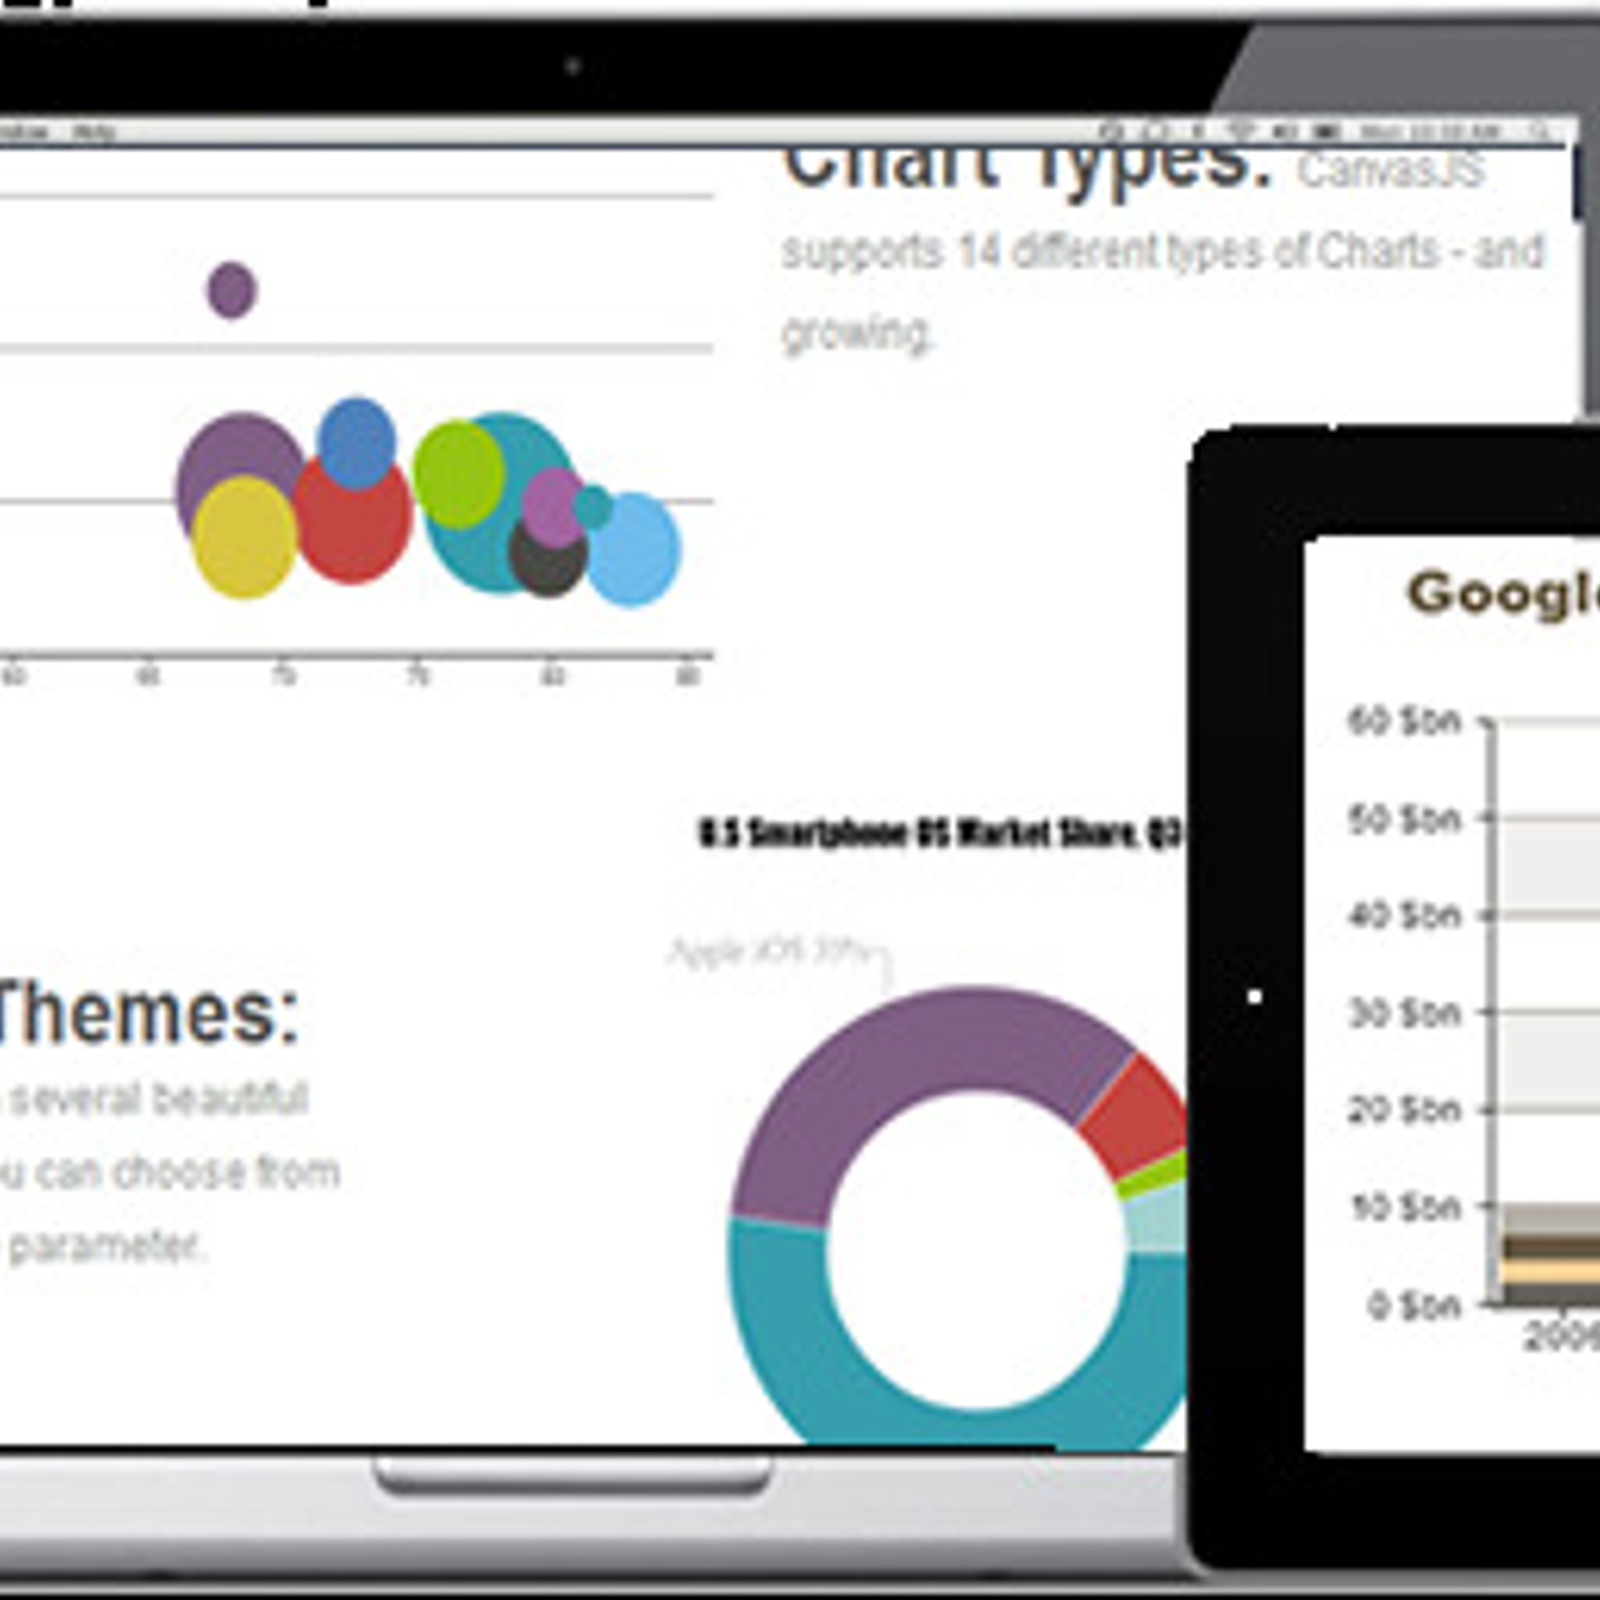
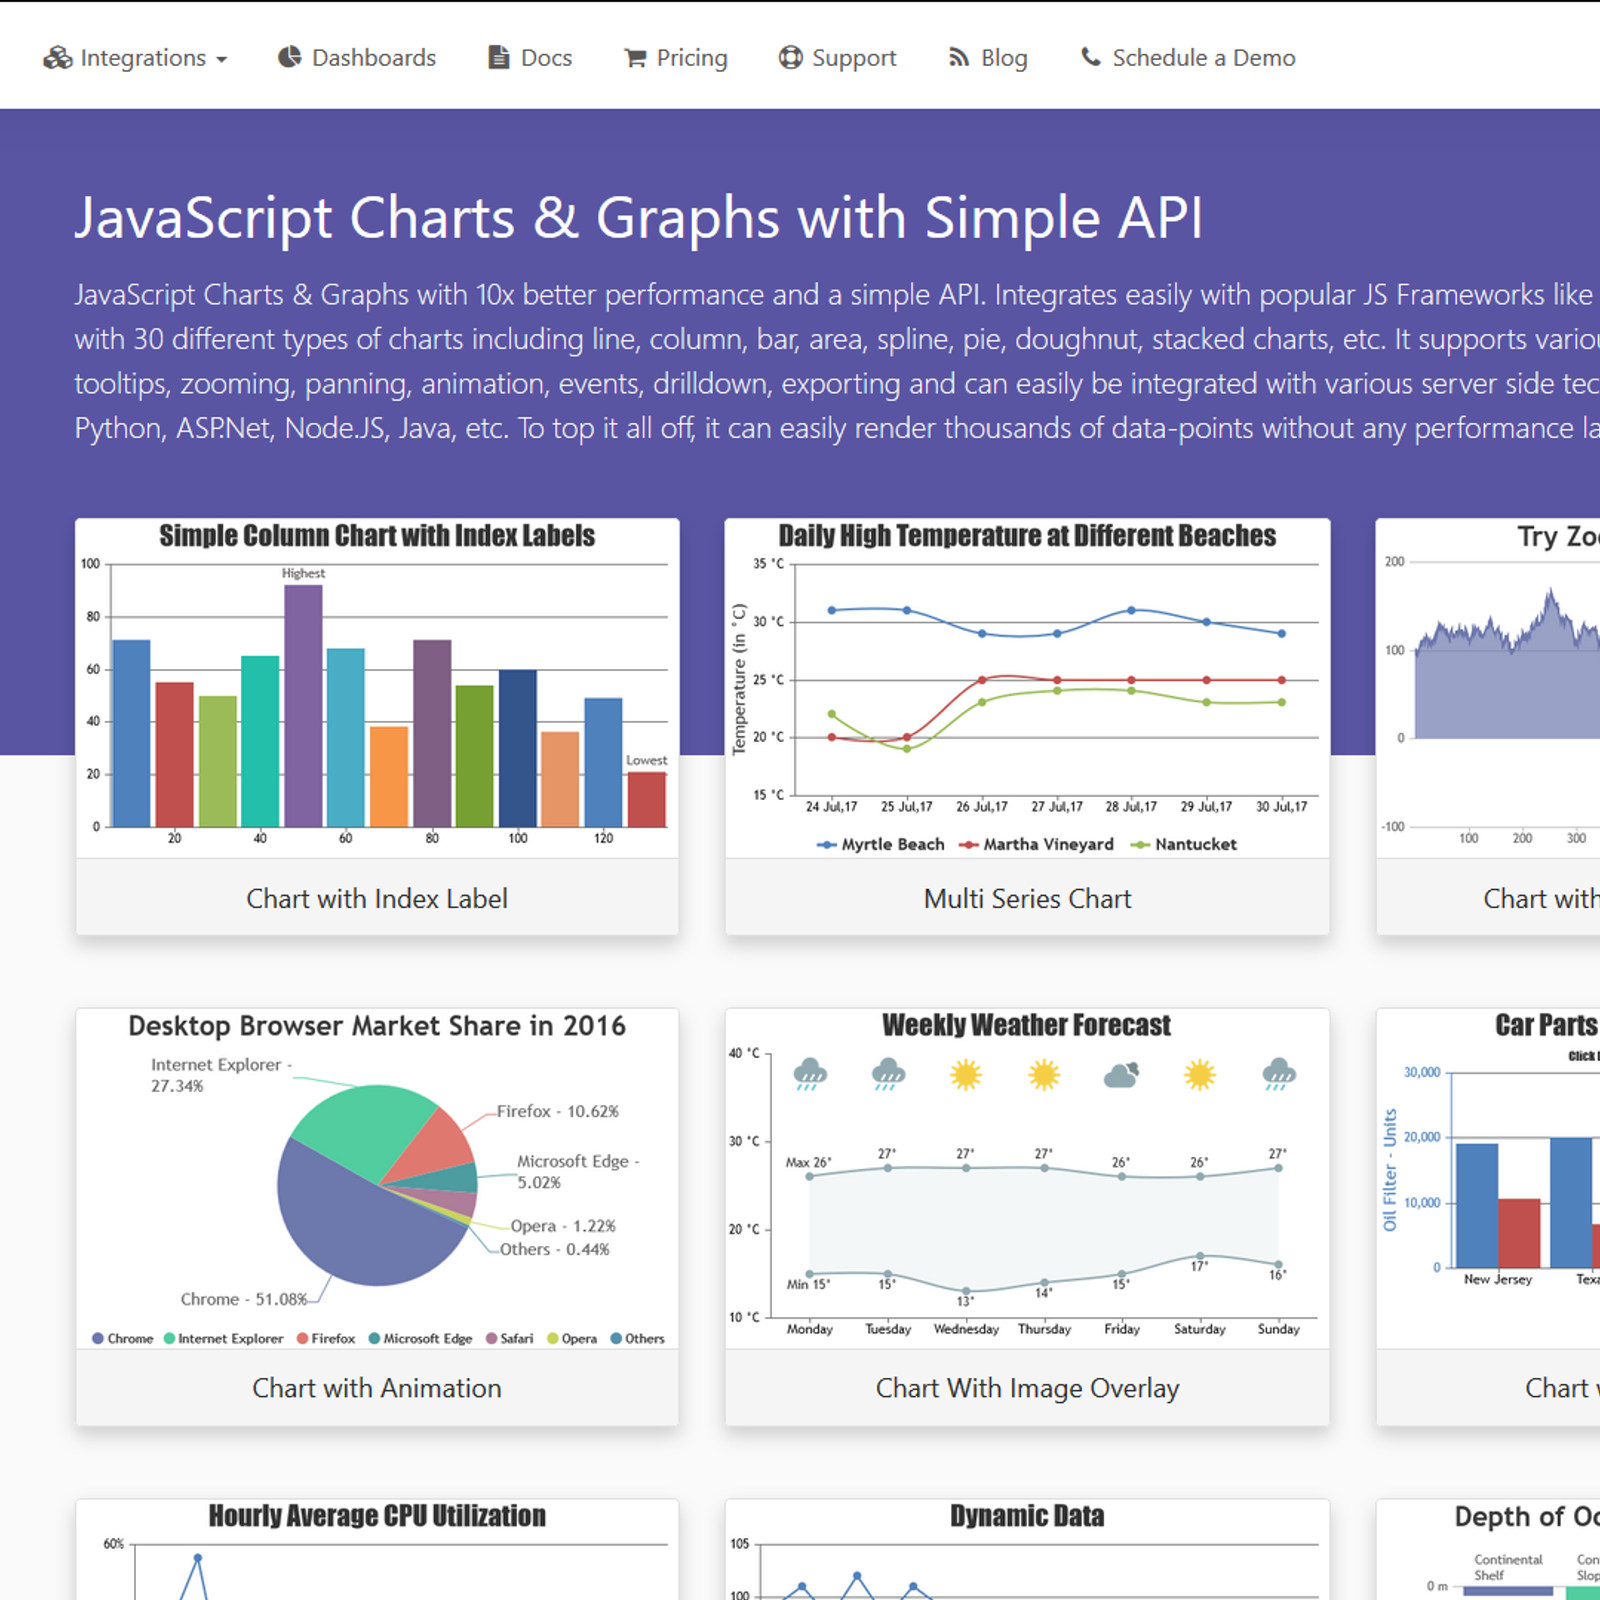
CanvasJS Charts is an easy-to-use charting library for creating interactive charts and graphs. It is a powerful, feature-rich chart library that allows users to quickly create stunning charts and data visualizations. With CanvasJS Charts, users can easily create bar graphs, line graphs, pie charts, scatter plots, and more. It also offers a rich set of features such as tooltips, animation, and data labels. CanvasJS Charts is fully compatible with modern web browsers and mobile devices, making it an ideal choice for developers who want to create interactive charts and graphs.


 D3.js
D3.js
 RAWGraphs
 Chart.js
 Plotly
 NVD3
NVD3
 Google Charts
 AnyChart
 Highcharts
 Bokeh
Bokeh
 Frappé Charts
 dc.js
dc.js
 Vis.js
 Raphaël
 Datamatic.io
 Epoch Charting Library
 amCharts
 PykCharts.js
 Circos
CanvasJS Charts Comments
No Comments