
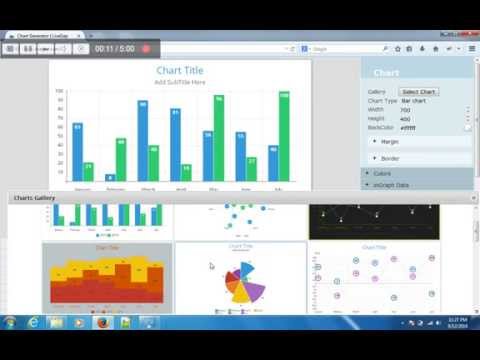
LiveGap Charts is an online tool that helps businesses and individuals to create and customize interactive charts and graphs. It provides an intuitive, easy-to-use interface that allows users to quickly create engaging visuals to better understand their data. With LiveGap Charts, users can create pie charts, line graphs, scatter plots, and more. The application also provides a library of templates that allows users to quickly get started with their projects. LiveGap Charts also provides advanced features like data filtering, sorting, and analysis tools, as well as data export options. This makes it easy to share and display data in a variety of formats. Additionally, users can share their charts with others and embed them in websites. With LiveGap Charts, users can quickly and easily create meaningful visuals that make data easier to understand.


 D3.js
D3.js
 RAWGraphs
 Chart.js
 Plotly
 NVD3
NVD3
 Google Charts
 Highcharts
 AnyChart
 Frappé Charts
 CanvasJS Charts
 Raphaël
 dc.js
dc.js
 PykCharts.js
 ZoomCharts
 ZingChart
 RGraph
 ChartURL
 ChartBlocks
 FusionCharts Suite XT
liveGap Charts Comments
No Comments